Goal
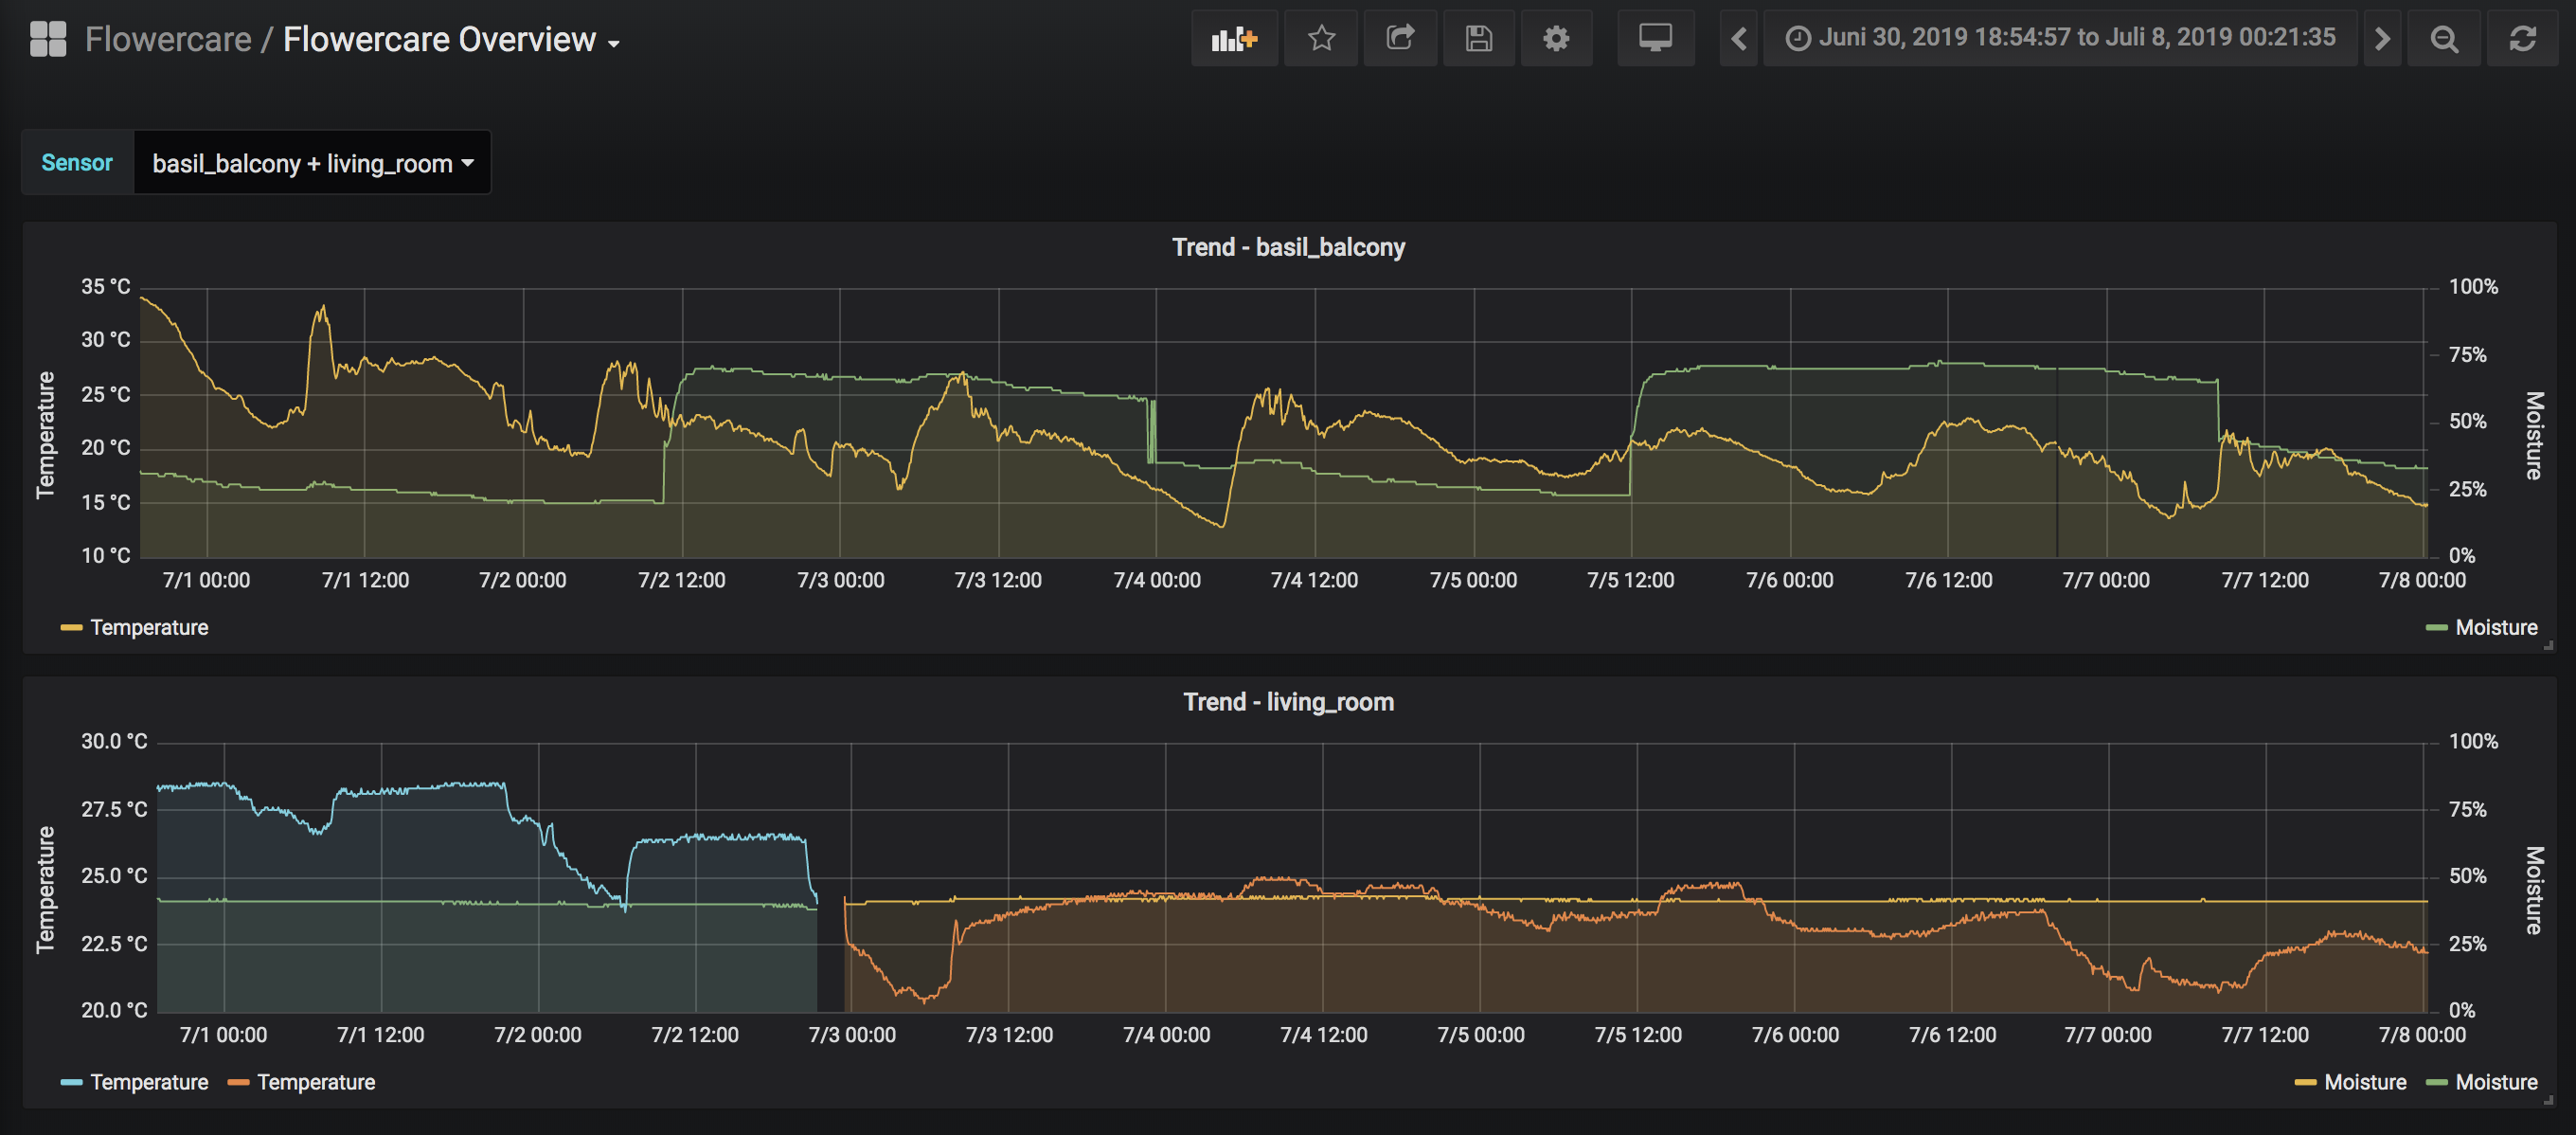
After following the steps below you’ll be able to visualize metrics from plant sensors in Grafana:
Prerequisites
You’ll need these systems:
prometheus server- a system running Prometheus and Grafanaplant exporter- a system with a bluetooth adapter that’ll export the plant sensor metricsplant sensors- sensors that can be queried via bluetooth
Shopping List
- CSR Bluetooth V4.0 USB Adapter - 5€
- Xiaomi Mi Flora Monitor - 15€/Unit
- Note: there’s a Chinese and International version - it’s recommended to pick the latter
Setup
On the prometheus server add the following entry to the scrape_configs section of your Prometheus.yml and adjust the hostname/port for your setup accordingly:
  - job_name: "flowercare"
    scrape_interval: 60s
    static_configs:
      - targets:
        - http://raspberrypi.fritz.box:9294
The metrics will be exposed by the plant exporter under http://raspberrypi.fritz.box:9294/metrics. In my case that is a raspberry pi 2b with a USB bluetooth adapter. I had a few problems getting bluetooth to work on it but I won’t get into detail about that here to keep this post concise.
⚠️ Note:
For step 3 enable the sensors consecutively to not confuse them. I recommend writing the last 1-2 sections of the mac address on the sensor to easily distinguish them.
1) run the bluetooth cli
# sudo bluetoothctl
[NEW] Controller 00:1A:7D:DA:71:13 raspberrypi [default]
[bluetooth]#

2) enable scanning for nearby devices
[bluetooth]# scan on

3) Enable the sensor and look for lines that end in "Flower care", e.g.
Device C4:7C:8D:xx:xx:xx Flower care

4) Disable scanning when you're done
[bluetooth]# scan off
Discovery stopped
[CHG] Controller 00:1A:7D:DA:71:13 Discovering: no
[bluetooth]# exit
Now that you know the mac addresses of your sensors, it’s time to install the flowercare-exporter on your plant exporter. Run it by specifying
key=value pairs consisting of an arbitrary display name that will be stored in the name label of each metric and the mac address of the sensor, e.g.:
$ flowercare-exporter -s living_room=C4:7C:8D:11:22:33 -s basil_balcony=C4:7C:8D:AA:BB:CC

INFO[0000] Bluetooth Device: hci0
INFO[0000] Sensor: living_room (c4:7c:8d:11:22:33)
INFO[0000] Sensor: basil_balcony (c4:7c:8d:aa:bb:cc)
INFO[0000] Startup complete.
INFO[0000] Listen on :9294...
To verify that your exporter works, open its metrics endpoint (the one that you listed in the Prometheus scraping configuration earlier). You should get a lot of text output similar to this:
# HELP flowercare_battery_percent Battery level in percent.
# TYPE flowercare_battery_percent gauge
flowercare_battery_percent{macaddress="c4:7c:8d:11:22:33",name="living_room"} 98
flowercare_battery_percent{macaddress="c4:7c:8d:aa:bb:cc",name="basil_balcony"} 99
[...]
The flowercare-exporter will log errors sometimes:
INFO[305162] Error updating "living_room (c4:7c:8d:11:22:33)": can not read firmware: exit status 1
INFO[316561] Error updating "living_room (c4:7c:8d:11:22:33)": can not read firmware: exit status 1
INFO[338161] Error updating "living_room (c4:7c:8d:11:22:33)": can not read firmware: exit status 1
INFO[344046] Error updating "basil_balcony (c4:7c:8d:aa:bb:cc)": can not read firmware: exit status 1
This typically means that for some reason the exporter could not contact the sensor. Most often this is caused by too much distance between plant sensor and bluetooth adapter but can also happen randomly for no apparent reason.
At this point, your plant sensor metrics will be scraped by Prometheus every minute. Finally, you can import the dashboard from this gist to see graphs from the screenshot at the top.
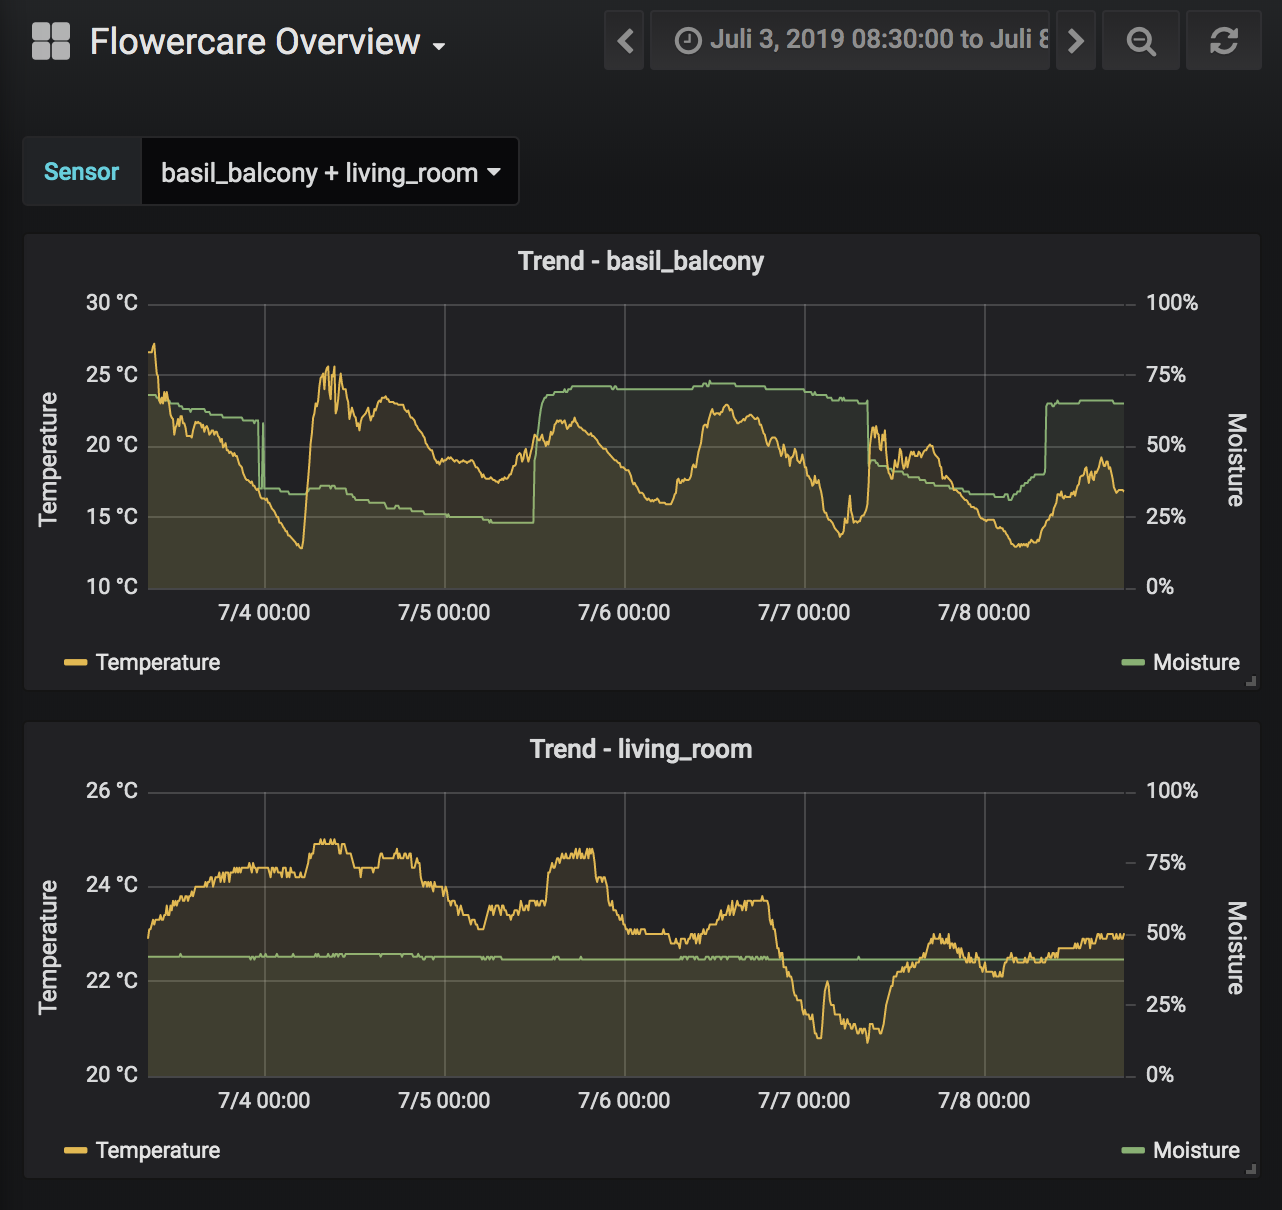
Addendum
I originally bought 3 sensors (13€/unit) and one died only a week after its arrival. I updated my flowercare-exporter command by removing the k=v pair of the broken sensor and giving its name to a spare one. Since the combination of all labels uniquely identifies a metric in Prometheus, two time series are returned when filtering by name: